Results & Evaluation — Screenshot Report
This page presents the experimental outcomes using static screenshots captured during the lab demo. Evidence supports:
1) Headline Outcomes
Place the screenshots listed below in ./assets/results/
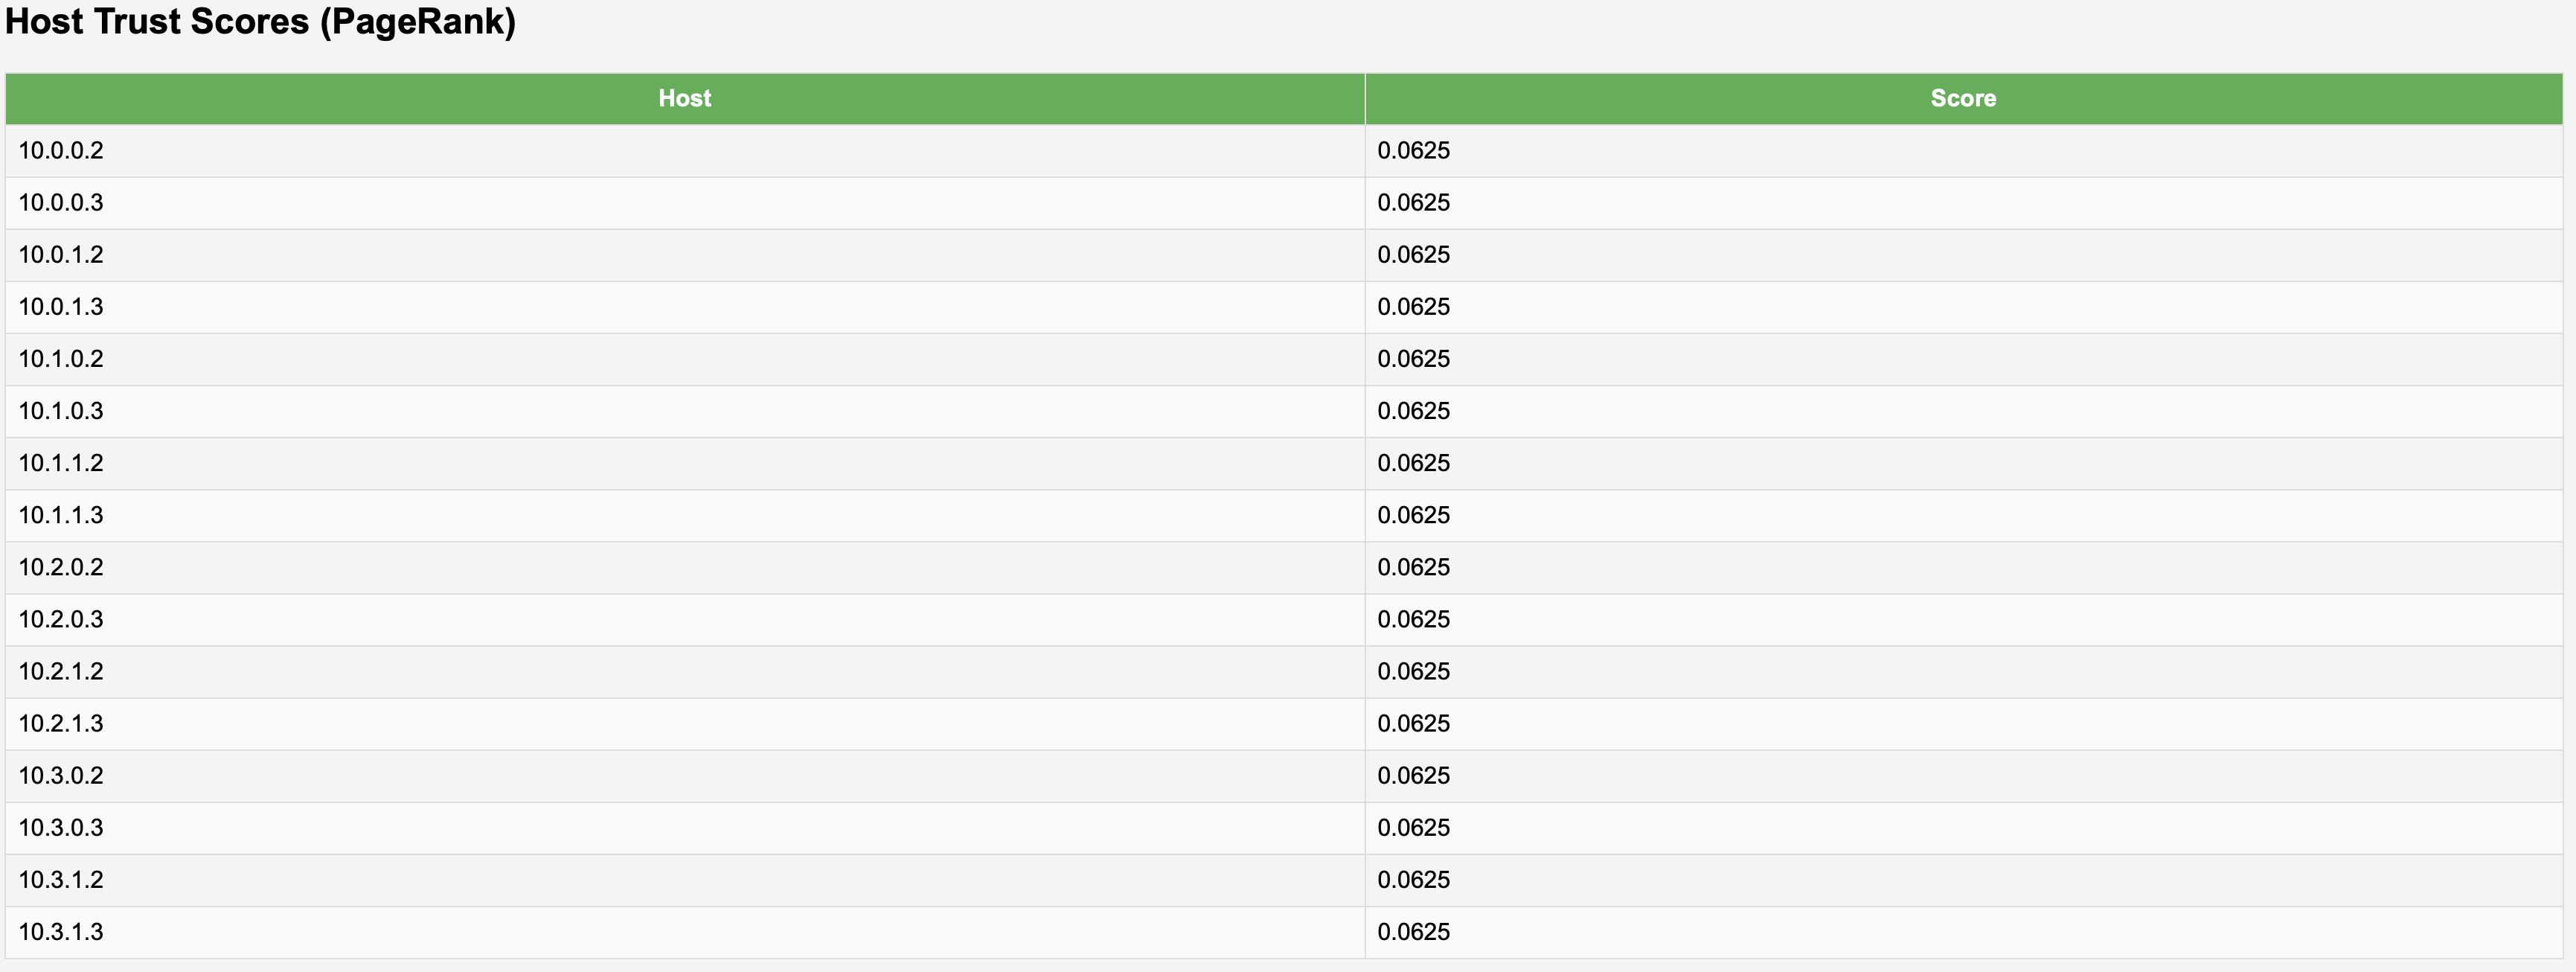
2) Trust (PageRank) Analytics
5) Controller Evidence (Ryu Logs)

6) Test Cases & Screenshots
Link each test case from test.sh to its evidence image. Update the “Observed” column briefly.
| Test Case | Description | Observed Controller Action | Screenshot |
|---|---|---|---|
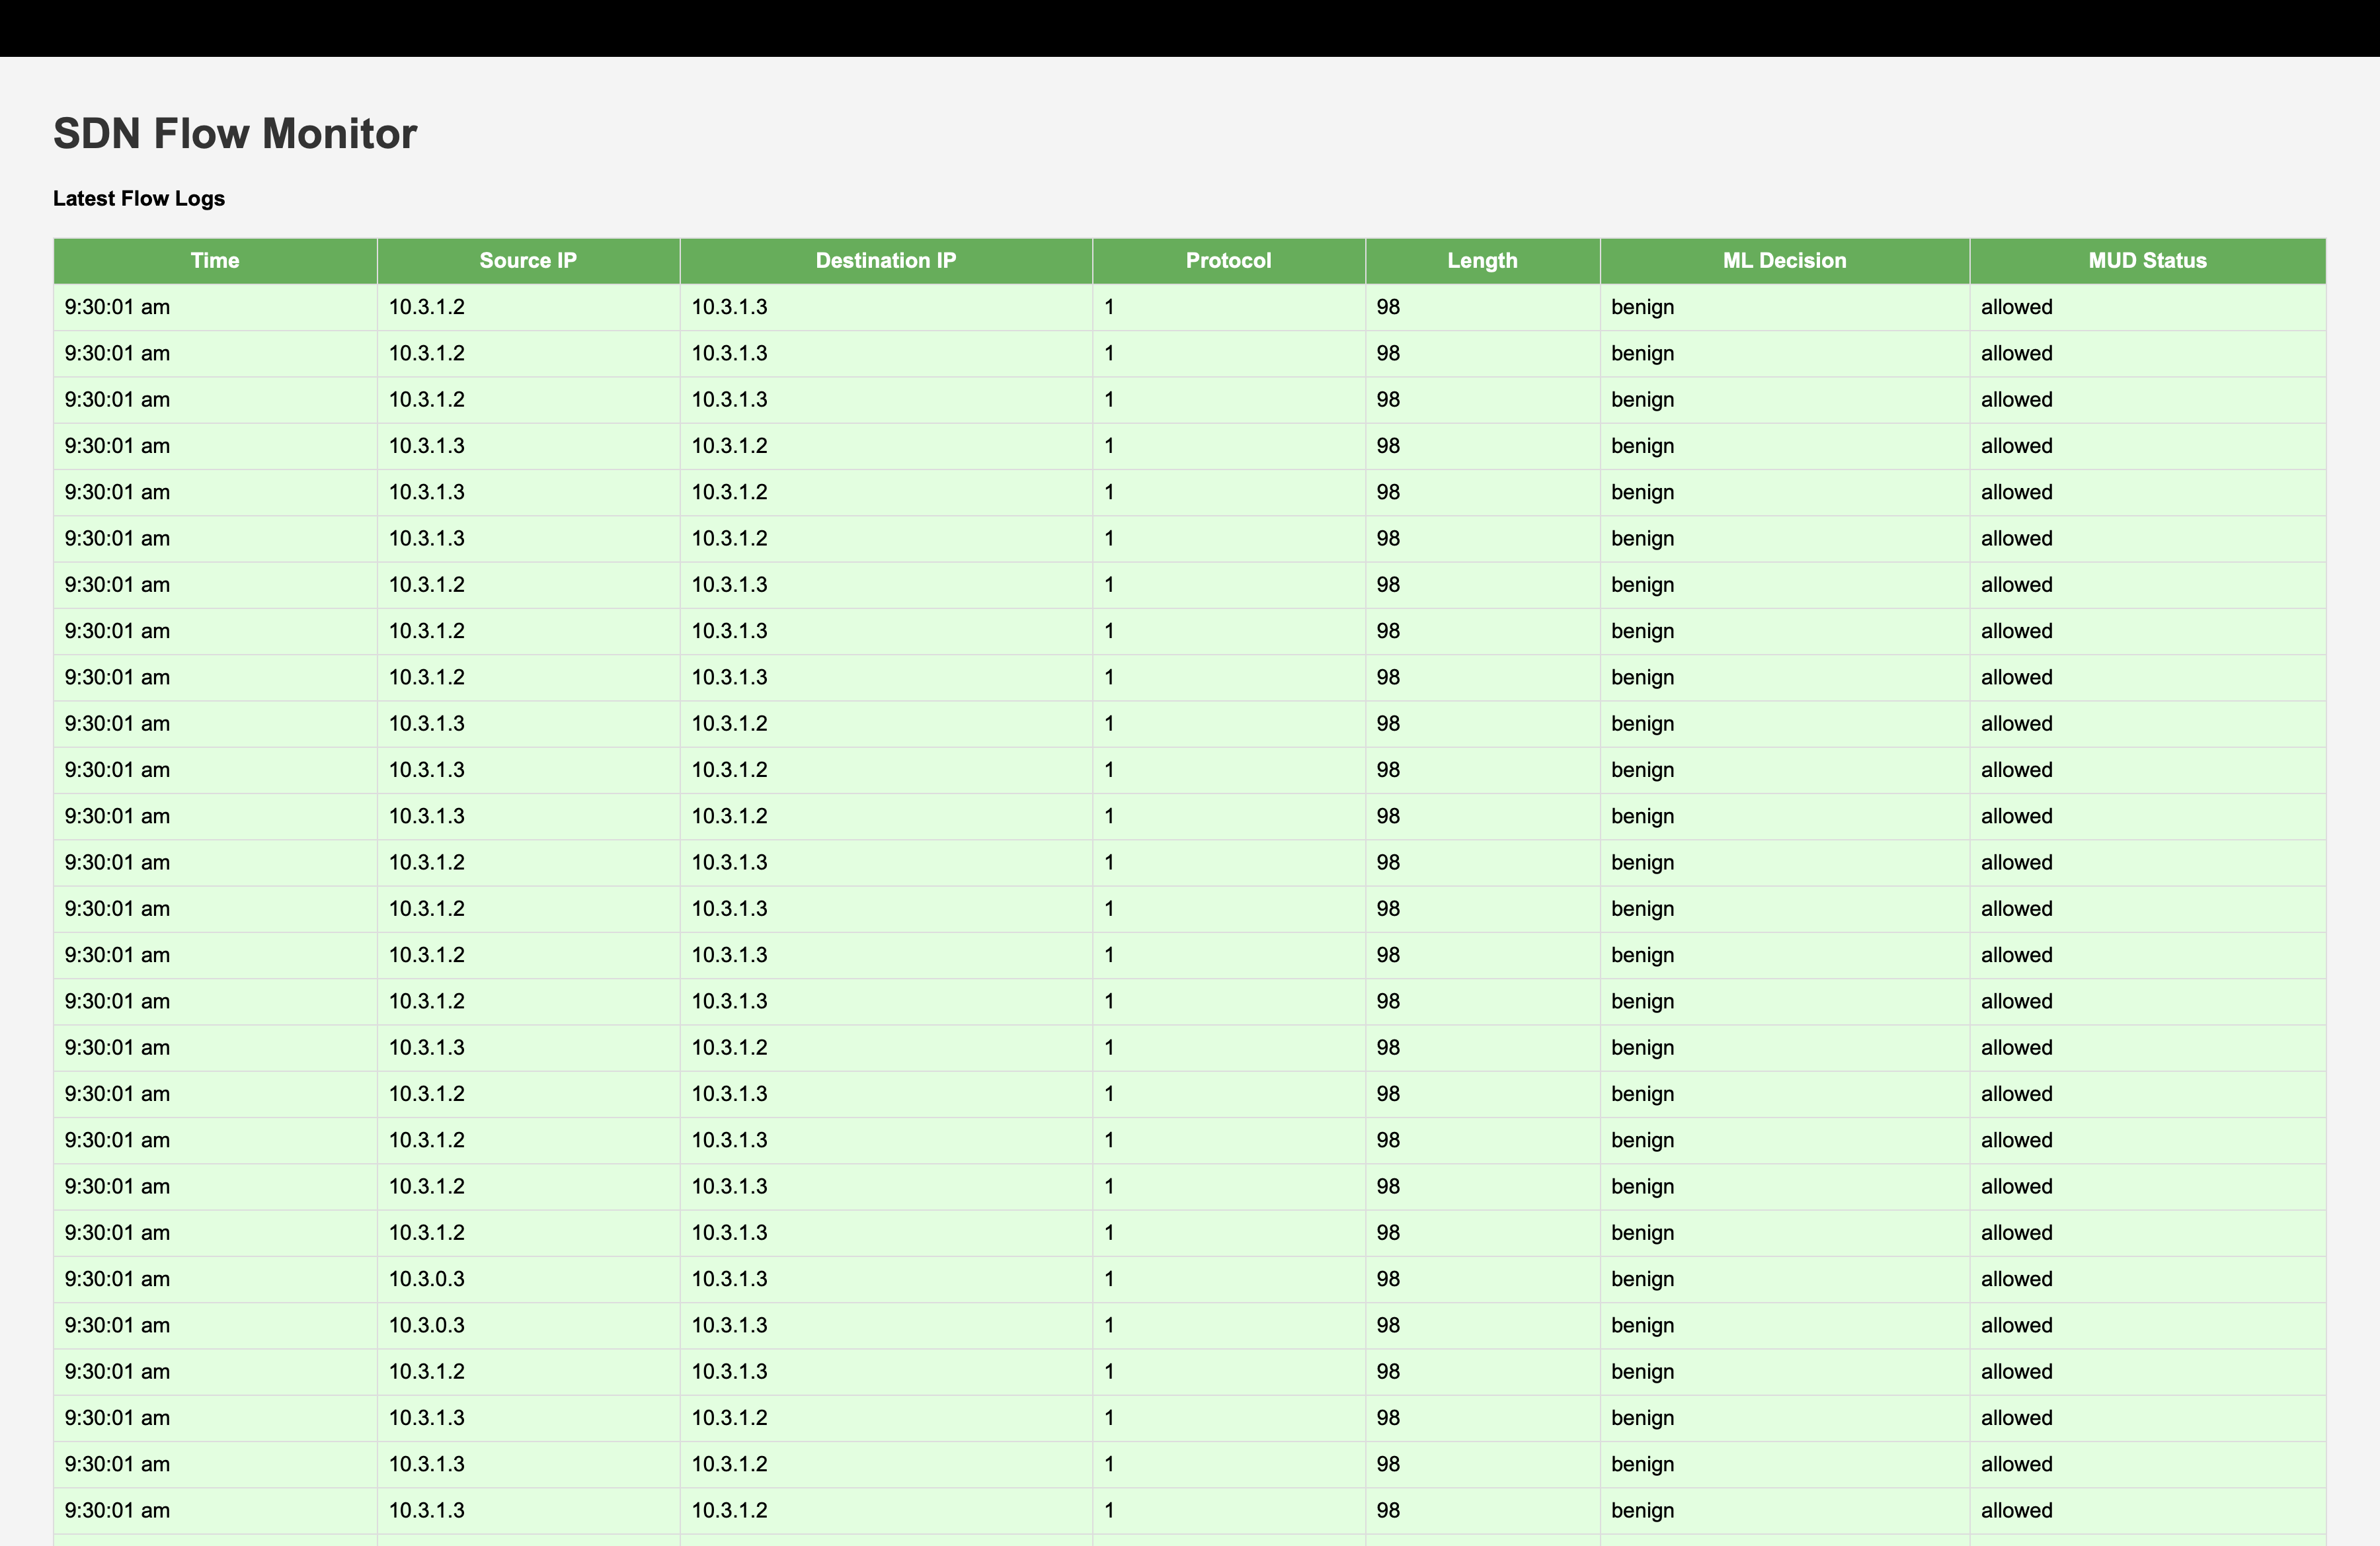
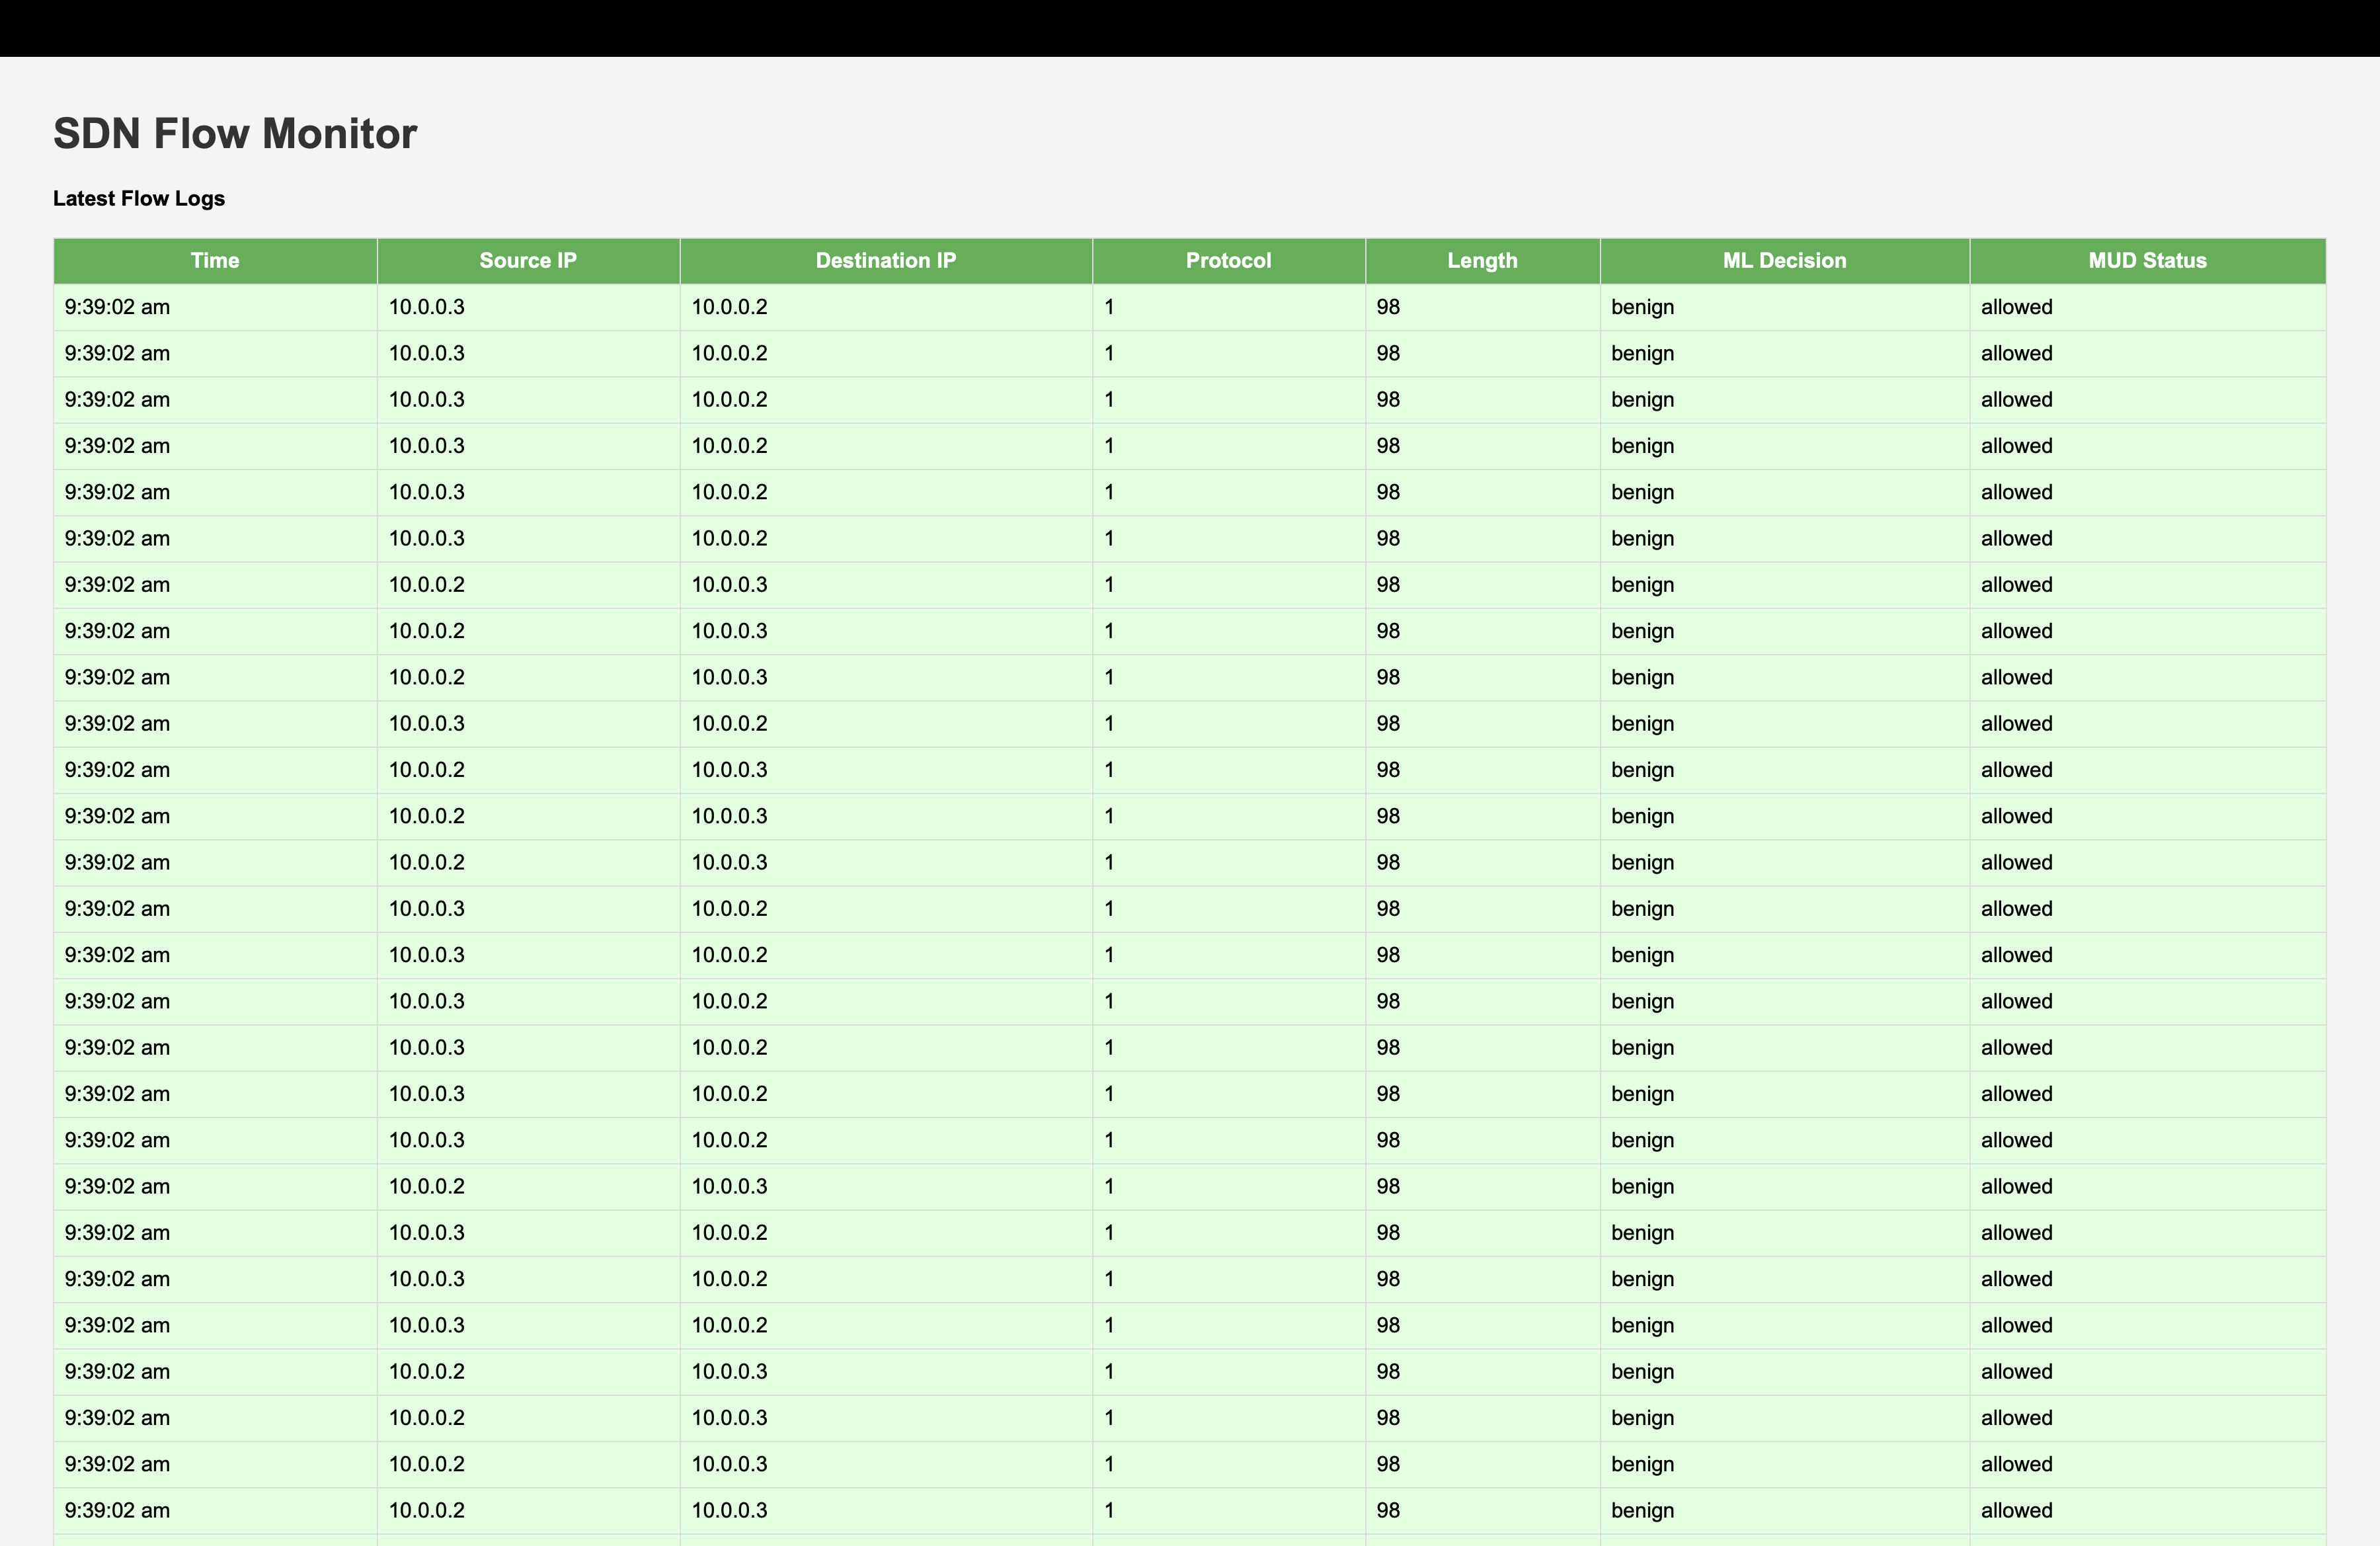
| TC1 | Benign baseline traffic (DNS/HTTPS) from IoT device | ALLOW (fast-path installed under MUD allowlist) | tc1_benign.png |
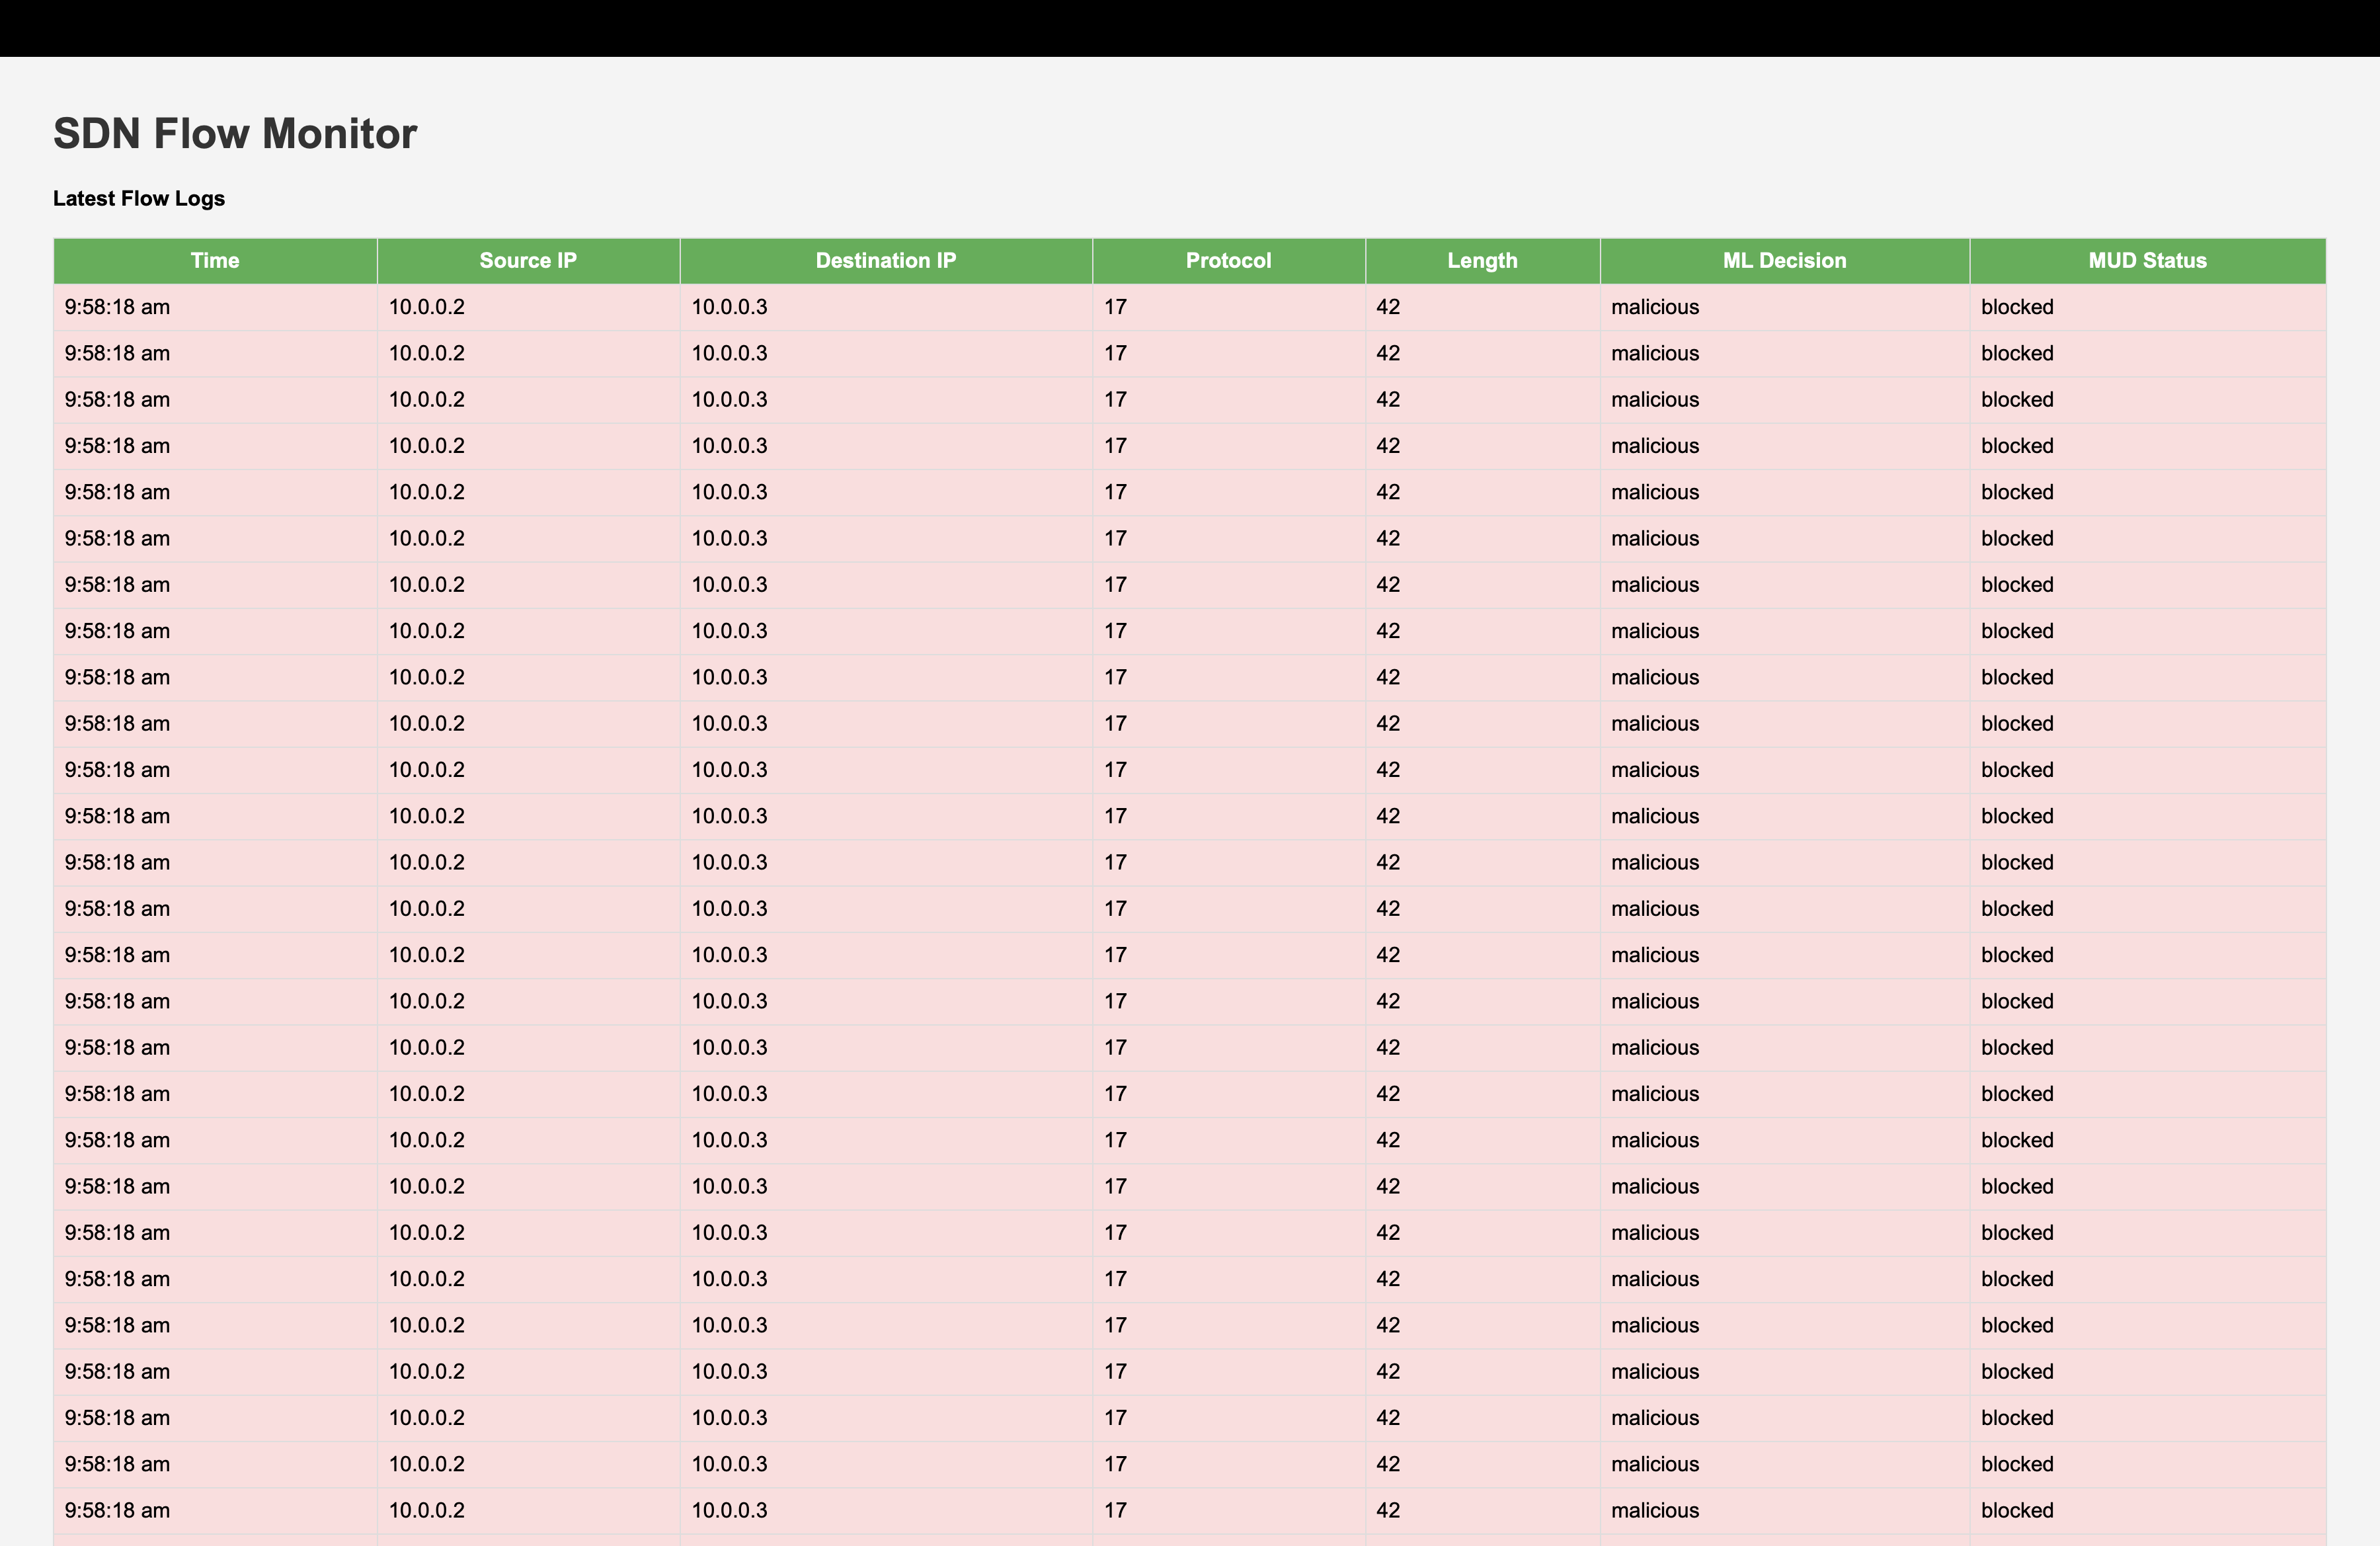
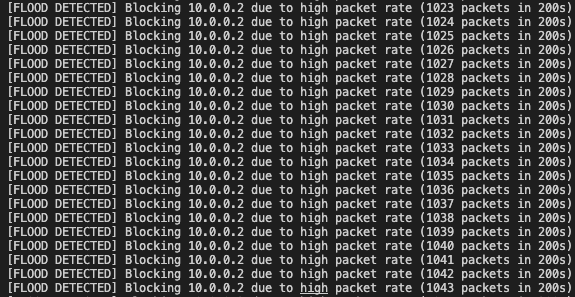
| TC2 | UDP Flood. | BLOCK on 1000+ packets during a UDP flood | tc2_udp_flood.png |
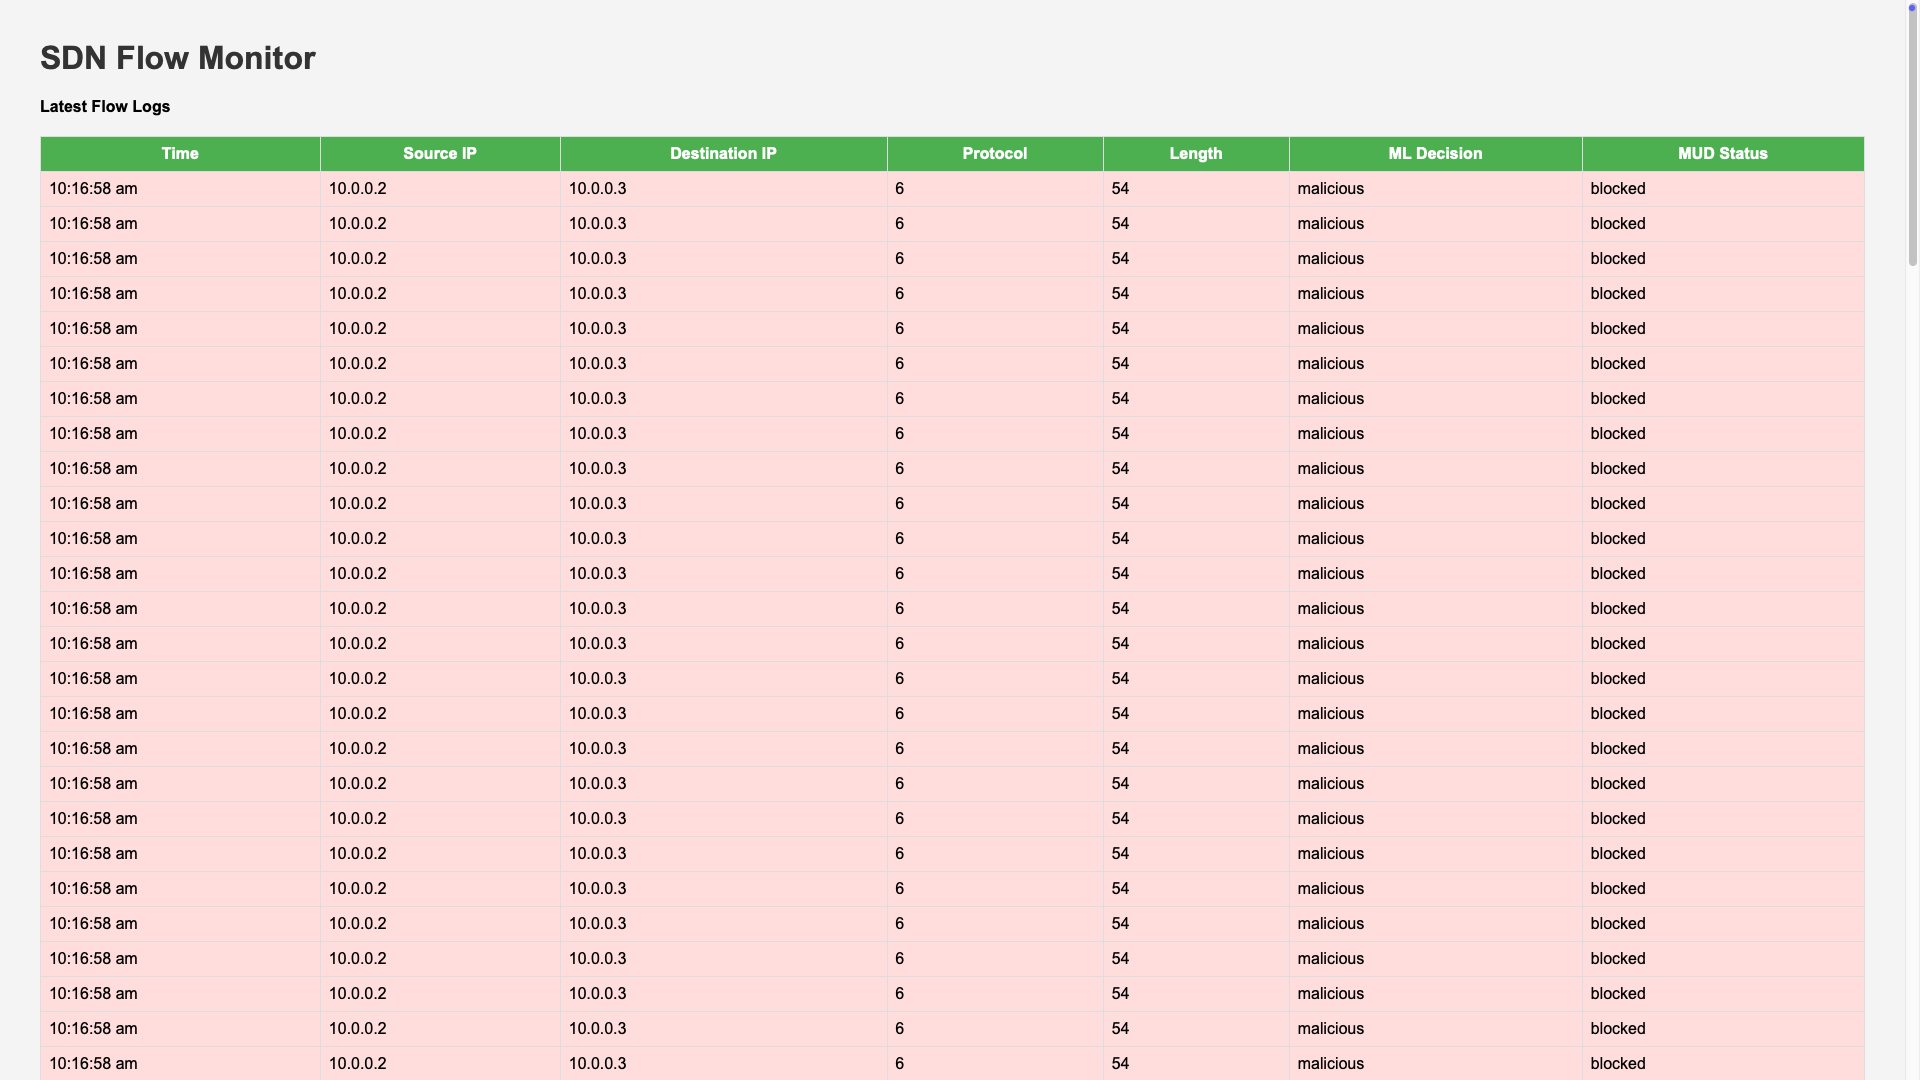
| TC3 | TCP SYN Flood | BLOCK and MALICIOUS | tc3_tcp_syn.png |
| TC4 | Flood processing outcome | RYU logs | tc4_ryu_flood_logs.png |
7) Observations & Analysis
MUD Baseline: Screenshots confirm that device-specific allowlists prevent off-policy flows (see “MUD vs Final Action”).
ML/Trust Added Value: Cases where MUD=ALLOW but the controller mitigates/blocks show the ML/Trust layer catching anomalies beyond static policy.
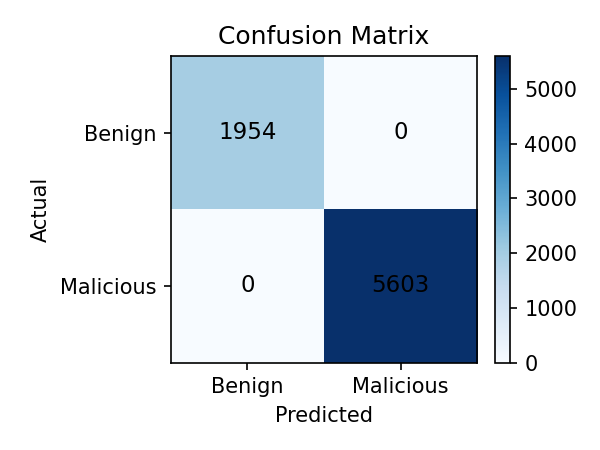
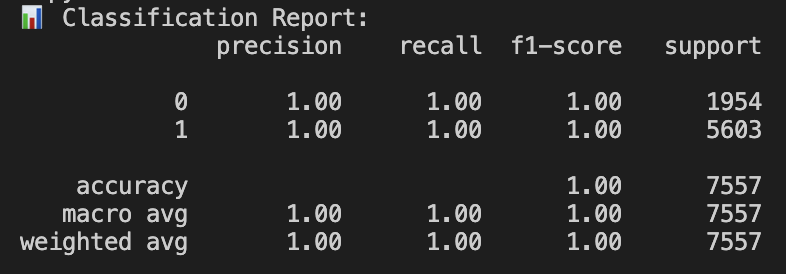
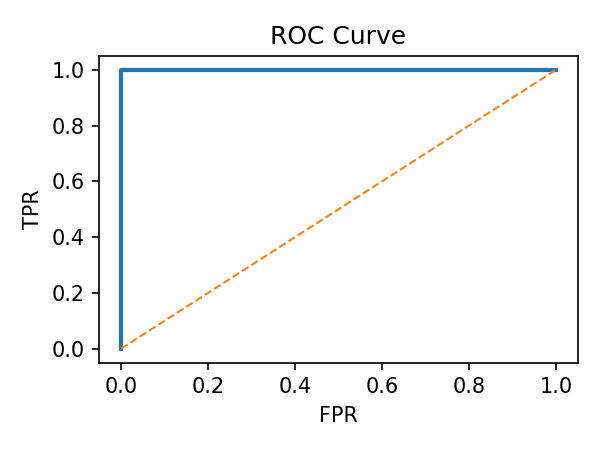
Performance Behaviour: During test bursts confusion matrix/ROC indicate reliable separation of benign vs malicious flows. A curve close to the top-left corner indicates strong performance with high detection rates with few false alarms.
Trust Correlation: Low-trust devices (PageRank) align with higher intervention rates, supporting prioritised scrutiny.